Operator screens that bind to live tags and ship as files.
Thermite SCADA serves browser screens from each published project. Screens are HTML, CSS, and JavaScript under screens/<name>/, with a supplied browser API for tags, writes, and history. Review your files in Git, try a draft, and publish when you decide it is ready.
Hand over the drawing. Get it back live.
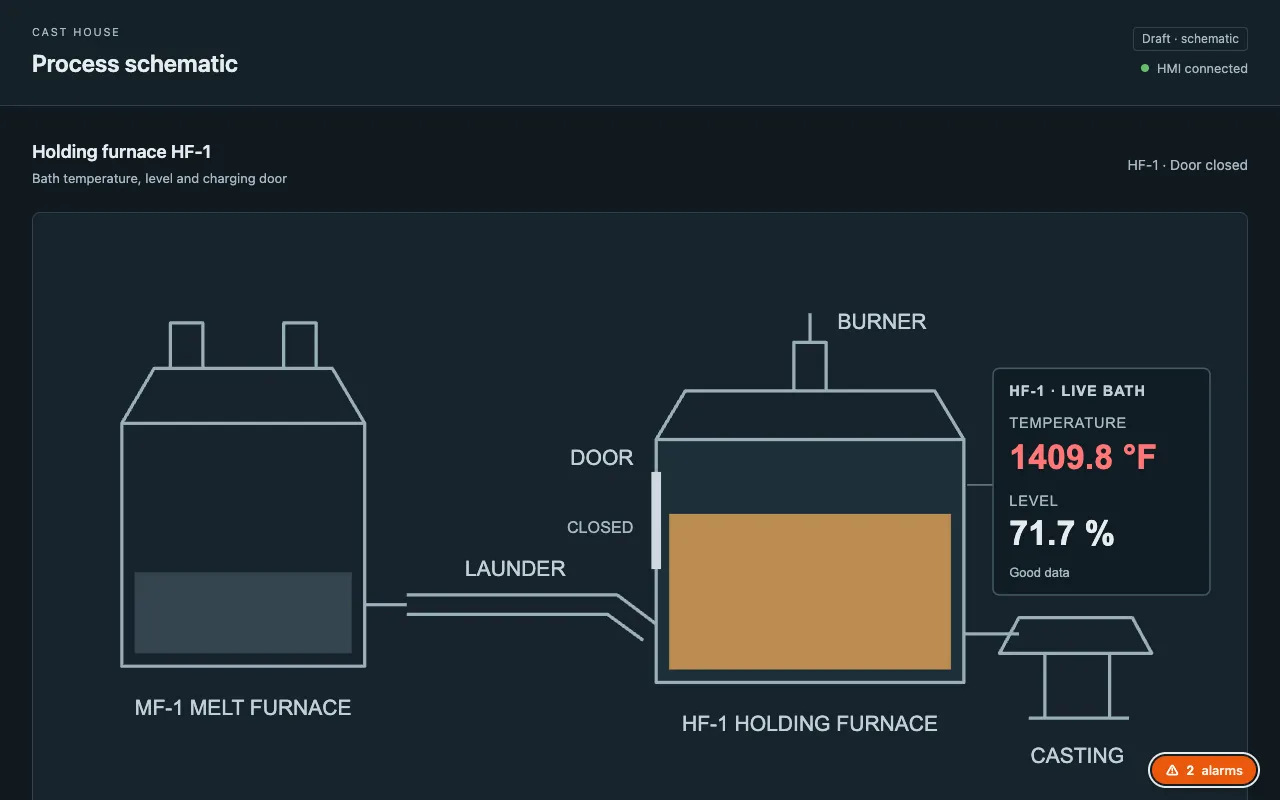
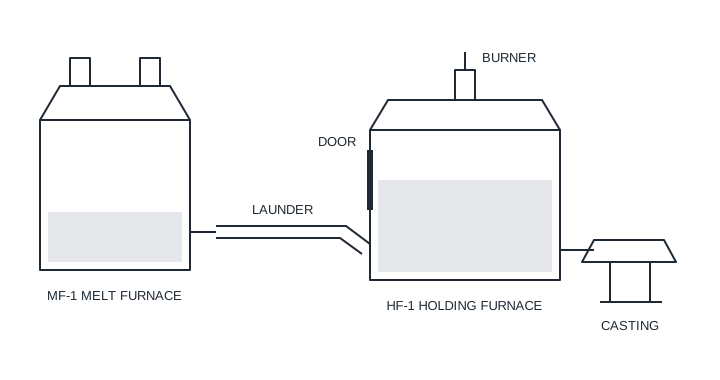
Screens are HTML, CSS, and JavaScript, so an SVG drawing works as it is. There is nothing to import: the file goes in the project folder. We gave an agent a cast house drawing and asked for a live schematic. This is the draft it put up.
You Our cast house drawing is in drawings/cast-house.svg. Build a schematic screen that shows it with live values: HF-1 bath temperature and level beside the furnace, the bath filled to the measured level, the door drawn open while it is open, and the temperature in red while its high alarm is active. Show me a draft.
Agent I’ll read the drawing and the live tags, then build and check a schematic draft. Production stays as it is.
Read drawings/cast-house.svg the HF-1 bath and door have ids, so they can move without redrawing the equipment
Fetch /p/cast-house/api/alarms hf1/bath_temp:hi, priority high
Write projects/cast-house/screens/schematic/ index.html, screen.js, style.css
Run thermite project draft cast-house schematic published as a draft; serves at /draft/cast-house/schematic/
Run node verification/check-states.cjs AssertionError: Open door must not obscure its state label
Agent My door-open check caught a layout problem: the open door crossed its status label. Moving the label clear.
Edit projects/cast-house/screens/schematic/ label moved clear of the open door
Run thermite project draft cast-house schematic draft replaced; the previous snapshot is kept
Agent Checked against the live furnace. The door opened on the drawing when hf1/door_open went true, the fill followed the level, and at 1,406.8 °F the alarm was active and the temperature turned red.
Agent The schematic draft is ready. Your drawing’s geometry and labels are unchanged, and so is production.
Like a readout? Ask for it by name next time.
After the schematic was up, we asked the agent to turn its live readout into a component and use it on the overview screen as well. It wrote one shared script, put both screens on it, and checked them against a real alarm.
It also wrote down how to call it, in the project. From then on, “a readout for tag X” on any screen is one call, and every readout shows quality and alarm state the same way.
// projects/cast-house/screens/shared/readout.md, as the agent wrote it
var temperature = TagReadout.mount(document.getElementById("temperature"), {
  tag: "hf1/bath_temp",
  unit: "°F",
  decimals: 1,
  min: 0,
  max: 6553.5,
  label: "HF-1 bath temperature"
});
The component is a plain script in the project’s screens folder, served by the gateway to production and to every draft.
Open your HMI in a browser.
The same Thermite SCADA gateway that runs your drivers serves the HMI. Operators connect from a desktop, a panel PC, a tablet, or a phone through your configured HTTPS proxy. With authentication on, project sessions govern browser access.
WebSocket data, with quality.
Tag subscriptions receive value, quality, and timestamp through a server-pushed stream. Screen authors use that context to distinguish good, stale, uncertain, and bad data in indicators and controls.
/p/press-line-a/hmi/overview/
Each project owns its screens, branding, role bindings, and URL surface. Pages are stored under the project folder and resolve against the project's tag namespace.
<!-- projects/press-line-a/screens/overview/index.html -->
<link rel="stylesheet" href="../thermite.css">
<div class="th-card">
  <div class="th-card-title">Head pressure</div>
  <div id="pressure">--</div>
  <div id="quality">Waiting for data</div>
</div>
<script src="../thermite.js"></script>
<script>
  Thermite.subscribe("hydraulics/head_pressure", function (tag) {
    document.getElementById("pressure").textContent =
      tag.quality === "good" ? tag.value + " psi" : "--";
    document.getElementById("quality").textContent = tag.quality;
  });
</script>
Publish your changes to activate a new snapshot. Open screens show an update banner, and operators refresh when ready.
Each screen is a directory containing index.html and supporting assets. Review the files in a pull request, check the screen in a published draft, and publish production with the CLI after your team has reviewed the result.
Browser APIs and a base theme for your screens.
Build custom industrial screens with HTML, CSS, JavaScript, the Thermite browser API, and the supplied base theme. Write graphics and charts in your project’s screen code.
Tag subscriptions
Numeric displays
Status indicators
History queries
Rows, grids & cards
Alarm indication
Buttons & setpoints
Connection events
Optional React hooks
From panel PCs to phones.
The base theme includes responsive rows and grids. Choose chart sizes, touch targets, and custom breakpoints for your panel PCs, tablets, and phones.
Writes are checked at the gateway.
The gateway checks project tag-write permissions for browser and API requests. Handle denied writes in your screen code and show operators the result of each command.
Tag-write audit records.
The audit log records tag-write events with the actor, target, submitted value, project identity, and outcome. Store runtime audit records with your site’s operational logs and recovery data.
Want to drive a Thermite SCADA HMI yourself?
Explore a working demo with simulated devices, live tags, and custom browser screens. Bring your own scenario.